

Press Releases
by Roel Aguilar and Tim Jed 30 minute read
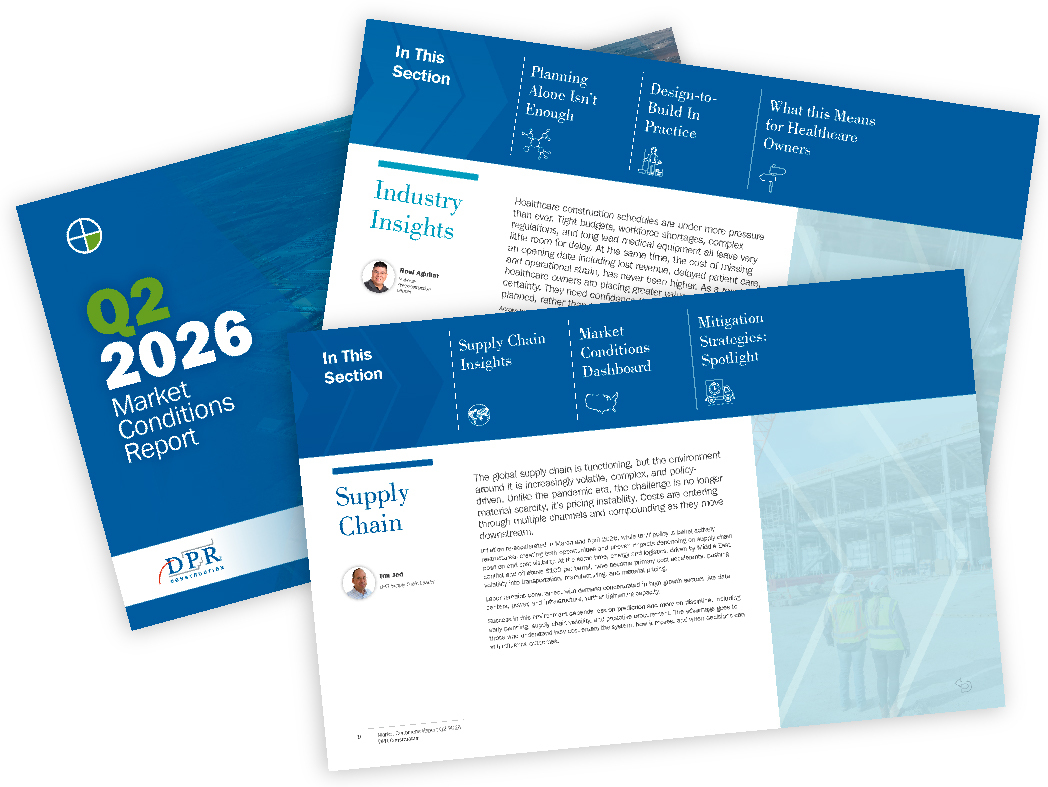
Our Q2 2026 Market Conditions report summarizes current market conditions, industry trends and mitigation strategies to make more informed business decisions in the quickly changing construction landscape.
Healthcare construction schedules are under more pressure than ever. Tight budgets, workforce shortages, complex regulations and long lead medical equipment all leave very little room for delay. At the same time, the cost of missing an opening date, including lost revenue, delayed patient care and operational strain, has never been higher. As a result, healthcare owners are placing greater value on schedule certainty. They need confidence that a facility will open when planned, rather than focusing on speed alone.
Across the industry, projects that bring designers and builders together early consistently perform better when it comes to staying on schedule. Decades of research shows that early collaboration between design and construction teams reduces schedule overruns and late-stage disruptions, even on highly complex healthcare facilities.
At DPR, we pursue schedule certainty through an integrated approach we call Design-to-Build. Design-to-Build is not a contract type; it’s a way of working that embeds construction expertise into the design phase. No matter the procurement method, this approach helps teams make informed decisions earlier, understand cost and schedule impacts in real time, and minimize downstream surprises.
Healthcare schedule challenges result from layered regulatory and operational systems rather than scheduling variability. Projects must align clinical workflows, equipment planning, life‑safety systems, infection‑control strategies and regulatory approvals, often across multiple authorities and stakeholder groups. Many of these requirements directly influence the critical path and become increasingly difficult to change once execution begins.
Finally, a large share of healthcare work occurs on active campuses. Site congestion, interim life‑safety measures, infection control and operational continuity impose real constraints on sequencing. In these environments, late decisions and late changes tend to compound quickly and can often trigger rework, re‑review and disruption.
“Early alignment across the owner, designer, builder and key trade partners enabled critical decisions like building systems, logistics and campus integration to be resolved before they became cost or schedule issues in the field.”
— From the Field
Multiple decades of independent research demonstrates a strong relationship between delivery approach and schedule outcomes. Studies summarized by the Design‑Build Institute of America (DBIA) report that integrated design‑build delivery performs best in schedule reliability and delivery speed compared to traditional delivery methods, with less schedule growth and faster delivery from design through completion in the studied project sets.
Healthcare‑specific research reinforces the conclusion that complexity does not eliminate the advantage. Comparative studies examining design‑build healthcare facilities alongside other building types found that schedule performance is driven less by project type and more by when decisions are made and how coordination is managed.
For healthcare owners, schedule certainty is directly connected to operations and finance. Activation milestones are tied to staffing plans, licensing, commissioning and service‑line strategies. Delays can defer patient access, extend reliance on aging infrastructure or require interim operational workarounds. In a constrained capital environment, these impacts compound quickly.
Recent industry surveys also highlight how late changes and readiness requirements create delivery friction. Healthcare facilities leaders increasingly emphasize commissioning, operational readiness and alignment across stakeholders as essential to opening-day performance.
Early alignment between the owner, designer, builder and key trade partners enabled critical decisions related to building systems, logistics and campus integration to be resolved before construction began. Addressing those decisions early helped mitigate escalation, labor constraints, supply‑chain uncertainty and the complexity of building within an active healthcare environment reducing the likelihood of late redesign, rework or downstream schedule disruption.
At DPR, Design‑to‑Build is not a contract type. It is an integrated project approach that brings construction knowledge into the design phase regardless of contracting method, project type or design stage to improve outcomes. The approach is based on early team engagement, design integration and use of capabilities such as advanced VDC, self‑perform work and prefabrication.
Design‑to‑Build focuses on aligning decisions early, way before they become constraints in the field. Traditional models often separate design and construction into sequential phases; in healthcare, that separation can delay decisions on systems, phasing and procurement in schedules that already have limited flexibility. Design‑to‑Build closes that gap by integrating the right expertise early and continuously connecting decisions to their cost, schedule, and operational implications.
“The greatest schedule benefit came from shifting repeatable work offsite through prefabrication and standardized systems which reduced onsite labor demand, improved productivity and lowered congestion on a complex active campus.”
— From the Field
Building on an active healthcare campus comes with real challenges. Teams have to manage safety, infection control, tight sites and day-to-day hospital operations, all while staying committed to a fixed opening date. That’s a lot to balance.
An integrated approach helps by tackling these challenges early, before construction starts and before crews are on site. Logistics, phasing and access planning are worked through during design, when changes are easier and less disruptive. Strategies like offsite fabrication and early coordination reduce congestion on campus and support cleaner, more controlled work alongside patient care.
Across complex, occupied projects, the same lessons show up again and again: align early, keep decisions transparent, stay disciplined with coordination and use standardization or prefabrication where it truly lowers schedule risk. These fundamentals translate well to any live environment, especially healthcare.
In today’s healthcare market, certainty has become a key measure of success. Owners need confidence that projects will open when planned. Integrated delivery approaches can deliver that reliability—but only when early alignment is carried through with consistent planning, clear decision-making and shared accountability.
Design-to-Build is best thought of as a practical way to protect the schedule. By making the decisions that affect procurement and construction earlier, connecting cost and schedule impacts in real time, and reducing late-stage surprises, teams can stay in control even in a volatile environment.
The payoff isn’t just speed. It’s greater confidence in opening dates, fewer late redesigns and rework cycles, and a project that’s better prepared to absorb uncertainty without putting patient care or operations at risk.
The global supply chain is functioning, but the environment around it is increasingly volatile, complex and policy-driven. Unlike the pandemic era, the challenge is no longer material scarcity, it’s pricing instability. Costs are entering through multiple channels and compounding as they move downstream.
Inflation re-accelerated in March and April 2026, while tariff policy is being actively restructured, creating both opportunities and uneven impacts depending on supply chain position and cost visibility. Compounding these pressures, energy and logistics—driven by Middle East conflict and oil above $100 per barrel—have become primary cost accelerants, pushing volatility into transportation, manufacturing, and material pricing.
Labor remains constrained, with demand concentrated in high-growth sectors like data centers, power and infrastructure, further tightening capacity.
Success in this environment depends less on prediction and more on discipline, including early planning, supply chain visibility and proactive procurement. The advantage goes to those who understand how cost enters the system, how it moves and when decisions can still influence outcomes.
To understand what is happening in the supply chain, it helps to start with the broader economic backdrop. From that perspective, the signals are relatively steady, but when viewed more closely, particularly through the lens of construction, the picture becomes more complex.
Unemployment has remained consistently in the range of 4% to 4.5% since mid-2024, and in April of 2026 was 4.3%,1 the same as March and slightly down from February. Contractors across the industry continue to report difficulty finding workers, and not just in isolated trades. The shortage spans mechanics, ironworkers, electricians, plumbers, equipment operators, carpenters, concrete workers, pipefitters, sheet metal workers, drywall trades, and truck drivers.2 That breadth is important. It indicates this is not a localized issue or a short-term imbalance; it is an industry constraint. It is also notable that these constraints persist even as some other segments of the economy show signs of cooling, so this is not merely a reflection of a ‘hot’ general labor market.
That labor constraint is echoed in wages. Construction wages are increasing faster than the broader private sector, approximately 5.1% compared to 3.7%.3 This gap reflects sustained pressure on labor supply. It is also tied, in part, to immigration dynamics, as a significant portion of the construction workforce in several trades is foreign-born. Changes in enforcement or availability in that labor pool can have an outsized impact on the industry, particularly in labor-intensive scopes where substitution is limited and schedule sensitivity is high.
While labor remains tight, inflation has reemerged as a more active factor. After remaining within a relatively stable range for much of 2025, inflation increased from 2.4% in February to 3.3% in March, and then to 3.8% in April.4 This sudden shift is happening concurrent with rising construction input costs. The Producer Price Index for construction materials rose 1.7% in a single month, the largest monthly increase since January 2022, and it has now reached a three-year high,5 driven largely by fuel cost escalation tied to geopolitical instability in the Middle East, and illustrating how global events feed into domestic construction costs.
Contractors are approaching 2026 with a more measured outlook. Some growth is still expected, but it is not evenly distributed. Data centers, power, transportation, and infrastructure continue to post the strongest gains,6 while other sectors are softer. That concentration matters because it pulls resources—materials, labor, fabrication capacity, and even power capacity—toward a narrower set of projects and sectors. Data centers, for example, are not just buildings; they are energy-intensive systems that require substantial power generation and transmission support.
This creates simultaneous demand pressure on both energy systems and related construction segments. Contractors surveyed by the Associated General Contractors of America expect these segments to remain strong, even as they reported lower overall expectations for 2026 relative to 2025. In fact, nearly two-thirds expect to increase headcount despite persistent workforce shortages. That suggests that demand remains real and durable enough to require hiring, even while firms remain cautious about the broader environment.
Economic slowdown, followed by labor availability, and rising direct labor costs. The market appears to be managing two forms of uncertainty at once: the possibility of macroeconomic slowing on one hand, and the reality of labor and pricing pressure on the other.
Tariffs continue to further elevate cost pressure, particularly in metal-intensive trades, even though material lead times remain manageable, reinforcing that the current state is driven more by pricing volatility than by outright availability constraints. Material pricing trends entering 2026 reflect that pressure.
A Q4 2025 market analysis identified aluminum, structural steel shapes, bar joists, rebar, precast concrete, and sheet metal products as the most significant cost movers. These are not niche categories; they are core inputs, and movement in these categories have a project-wide effect.
And GEP’s Supply Chain Volatility Index has increased, reaching a three-year high.7 That volatility is being driven by transportation costs, shifting demand patterns, stockpiling behavior, and uncertainty in global supply.
Taken together, these signals point to a market that is stable in structure but increasingly dynamic beneath the surface. Labor constraints, shifting inflation, concentrated demand, and external cost drivers are all interacting at once. The market is not breaking down, but it is carrying more pressure than headline stability alone would suggest. Understanding how those pressures interact is key to understanding what comes next.
Tariffs have always influenced cost, but the pace and structure of recent changes have made them more difficult to predict, explain, and manage. The result is not simply higher prices in a broad sense. It is a system where trade policy is actively reshaping how cost enters the supply chain, where it sits, and who can manage it.
In February, a major inflection point came when the U.S. Supreme Court overturned the IEEPA-based “Liberation Day” or reciprocal tariffs that were imposed last year.8 The ruling took effect immediately and invalidated a tariff policy that had generated almost $170 billion in collections. Later that day, the administration implemented a 10% universal tariff, authorized for up to 150 days, while also indicating interest in pursuing permanence under alternate legal authorities. But on May 7th, a federal trade court ruled the 10% tariffs are unlawful, blocking enforcement for only two of the suing companies and Washington state; broader impact and appeals remain uncertain.9
For market participants, the legal back-and-forth continues to cloud the durability of U.S. tariff policy, leaving businesses navigating an environment where trade measures remain highly fluid and subject to ongoing challenge.
There were an estimated 330,000 importers of record and 53 million customs entry that were collected under the IEEPA “Reciprocal” Tariffs, at a value of $166B.
Under the revised framework, raw metal forms such as steel coils and aluminum sheet remain subject to a flat 50% tariff on full value. Derivative products substantially composed of these metals are generally assessed at 25%, while strategically important categories—such as electrical grid and industrial equipment—receive a temporary reduced rate of 15% through 2027.
Products manufactured abroad using entirely U.S.-origin metals qualify for a reduced 10% tariff, and products with minimal metal content are excluded entirely.
This allows duties to be calculated on the value of materials at an earlier stage of transformation rather than the final U.S. buyer price (e.g. a steel tariff applied to the cost of the steel coil instead of a final transformed state of a fabricated metal product).
This can reduce tariff exposure but requires deep upstream transparency and documentation—conditions that are often difficult to achieve in construction procurement environments visibility into earlier transactions is limited.
U.S. Customs and Border Protection (CBP) has since launched a refund portal to manage refunds (the Consolidated Administration and Processing of Entries, CAPE for short).10,11 Practical challenges are significant. Only importers of record and brokers may file claims, and many companies lack the visibility needed to isolate tariffs embedded in multi-tier supply chain structures, especially in construction where materials may pass from overseas manufacturers through wholesalers, distributors, or subcontractors before they reach the project.
There are also new changes to Section 232 tariffs which are reshaping how duties are calculated on key materials such as steel, aluminum, and copper.12 This change is intended to simplify tariff administration by eliminating the need to isolate embedded metal content across thousands of derivative products. But products that previously may have benefited from detailed valuation may now see higher effective duties, while other categories may see little change or reductions. Although this is a cleaner framework administratively, it seems to be in direct conflict with a long-standing rule to help manage cost for duties called the First Sale Rule.
Tariffs are no longer a background cost; they are pricing drivers. Their real-world impact depends heavily on how supply chains are structured, and whether the parties making project design decisions have visibility into where those costs are truly entering the system.
The conflict in the Middle East is not just a geopolitical event, it is a supply chain event, and one that touches nearly every part of the system. The reason is straightforward: energy sits underneath everything else. When fuel prices move, transportation, manufacturing, and delivery costs move as well. That is why the current disruption profile is so broad. It is not confined to a single commodity or route.
Following the escalation of conflict involving Iran on February 28, commercial traffic through the Strait of Hormuz declined by approximately 90%.13 The Strait is one of the world’s most critical chokepoints, handling roughly 20% of global oil supply and 25% of seaborne oil trade.14 That is why disruptions immediately translate into global pricing effects—it is a disruption to one of the world’s core energy arteries.
Crude oil prices surged above $100 per barrel,15 driving diesel and gasoline prices higher and triggering transportation surcharges across freight modes. Trucking companies, ocean carriers, manufacturers, fabricators, and airlines all respond to higher fuel inputs in some way—through surcharges, rate adjustments, reduced flexibility, or combinations of the three.
Construction industry data sources have already noted increased project delays and pauses tied directly to these fuel and logistics impacts.16 That is an important signal because it moves the issue out of the realm of abstract macro analysis and into project-level consequences. And when the Strait reopens, risk is expected to persist, as naval mines deployed during the conflict may take up to six months to clear, discouraging normal traffic flows.17 In other words, reopening does not mean things will return to the status quo instantly.
A notable counterbalance is the United Arab Emirates’ departure from OPEC.18 In the near term, limited impact is expected while the Strait of Hormuz remains largely constrained. Over the longer term, however, the implications are more significant. Freed from OPEC production quotas that cap output at roughly 3.2 million barrels per day, the UAE could increase production closer to its estimated capacity of 5 million barrels per day—adding approximately 1%–2% to global oil supply. Once shipping routes normalize, this additional supply could exert downward pressure on oil prices and weaken OPEC’s ability to constrain production, with broader positive implications for fuel and energy pricing.
Transportation disruptions like those occurring today do not exist in isolation. The ripple effects extend upstream into materials, downstream into projects, and laterally across energy, manufacturing, and logistics simultaneously. This is precisely why energy has emerged as the clearest multiplier in the current environment—when it moves, everything else moves with it.
Impact extends well beyond fuel at the pump. 24% of the global aluminum supply comes from the Middle East, amplifying price increases through both physical disruption and elevated transportation costs.19 Rising oil prices also increase electricity costs, indirectly elevating manufacturing costs for energy-intensive materials. Aluminum prices have risen significantly and are approaching levels seen during previous peaks.20
This is part of what makes fuel such a powerful multiplier. It is not just a transport input—it is embedded in material production as well.
Industries Affected by Middle East Supply Disruption Risks
Source: WITS, Morgan Stanley Research
| Product | Middle East Market Share | Importance | Industry Affected |
| Sulphur | 45% | Sulfuric acid and fertilizer |
|
| LPG (Butane/Propane) | Butane: 44% Propane: 25% | Fuel and petrochemical stock |
|
| Crude Oil | 34% | Base for fuels and chemicals |
|
| Helium | 33% | Semiconductors and MRI |
|
| Petrochemicals (Methanol/Butadiene) | Methanol: 30% Butadiene: 4% | Methanol: plastics & solvents Butadiene: synthetic rubber & engineering plastics |
|
| Aluminum | 24% | Transport and packaging |
|
| Urea / Diammonium phosphate /Ammonia | 22% | Crop nutrient |
|
| LNG | 19% | Electricity generation, industrial heat and ammonia stock |
|
| Light refined oil products | 17% | Olefin production |
|
Sulfur supply chains have also been impacted. Sulfur is a critical input for fertilizer production and for Indonesia’s nickel industry. Indonesia, the world’s largest producer of nickel, relies on the Middle East for roughly 75% of its sulfur supply. As a result, nickel-containing products—including stainless steel and other alloys—are experiencing additional pricing pressure. Nickel prices have risen since late 2025 but remain below their March 2022 peak.21,22 This is an example of how a geopolitical disruption in one region can travel through an input market and eventually affect a seemingly unrelated set of finished construction products.
Steel mills are operating at higher utilization levels, around 77% capacity.23 This indicates that supply is responding to demand and that production is not severely constrained. While availability has improved, pricing remains volatile. That volatility is being driven by external factors—tariffs, fuel costs, logistics pressure, and geopolitical disruptions—rather than by shortages within the material markets themselves. Section 232 tariffs remain part of the cost picture, but so do logistics costs and rising diesel prices. Rebar pricing, for example, may remain relatively stable at the base material level, while delivered costs may rise as transportation becomes more expensive.24
Copper, foundational to electrical systems, power infrastructure, and many building components, has reached levels described as ten-year highs, driven by both tariffs and global supply disruption.25 Given the continued strength in power-related and data center construction, copper’s pricing behavior has wider implications than a narrower commodity might.
The pressure is not confined to metals. The Middle East also plays a major role in supplying raw inputs used in plastics and chemical products.26 Petrochemicals used in insulation and waterproofing systems have likewise been affected, with manufacturers reporting pricing pressure. This extends into polymer-based systems and other materials tied to petroleum-derived inputs. These are not always the first materials people think about when discussing supply chain risk, but they are widely used and highly sensitive to petroleum costs and petrochemical feedstock disruption.
What is important from a project perspective is how these changes show up in specific systems. Feedback from manufacturers and suppliers points to several categories that are being hit hardest: glazing systems, HVAC, steel pipe and tube, roofing, and waterproofing, to name a few. These are not isolated components. They are integrated systems that often sit on the critical path of a project. When pricing increases in these categories, the impact is broader than a single material adjustment—it affects entire scopes of work, often those with significant schedule sensitivity.
But there’s good news, too. Investment in domestic production is increasing. The United States plans to build its first aluminum smelter since the 1980s, reducing reliance on foreign supply over time.27 Investment is also being directed toward domestic uranium enrichment capacity, supporting nuclear generation, which provides nearly 20% of U.S. electricity.28 Given the role of energy in driving material costs, this is a meaningful long-term signal. There are also efforts underway to diversify access to critical minerals, with notable meetings between the U.S. and the EU, Japan, and Brazil, with an aim to expand access through recycling and diversified sourcing.29
The impact on material movement extends beyond fuel surcharges. Port overcapacity, lane disruptions, and schedule instability are compounding to create significant uncertainty in project delivery timelines.
Ocean freight remains under pressure due to fuel escalation, port congestion, and rerouting around conflict zones.30 Congestion is not just a minor inconvenience. When large volumes of cargo are redirected to ports that are not designed to absorb them, it creates bottlenecks that ripple through the entire system. Delays at one point in the chain affect everything downstream. More than 80% of the world’s ports are operating under critical or severe congestion, with diversions around the Cape of Good Hope adding weeks to transit times.31 Emergency surcharges ranging from $1,200 to $3,500 per container—including war-risk and emergency conflict surcharges—have been widely implemented. They are real costs with real pricing impact.
Truck spot rates have risen to near two-year highs, and tender-rejection rates are approaching levels last seen four years ago, signaling tightening capacity.32 Carriers have increased leverage in load selection and are prioritizing higher-yield freight. For construction, that means transportation variability and delivered cost pressure can rise even if the underlying material market appears relatively stable.
Air freight is also under pressure. Approximately 20% of global jet fuel supply also transits the Strait, contributing to flight cancellations and fare increases as airlines respond to fuel constraints. Fuel costs are a major factor, and as jet fuel prices rise, airlines adjust pricing and capacity. This can extend lead times and increase costs, particularly for time-sensitive shipments or replacement materials where flexibility is already limited.
There are also fundamental factors affecting logistics capacity. In March 2026, approximately 13,000 non-domiciled commercial driver’s licenses in California were challenged through federal enforcement actions requiring lawful domicile.33 While intended to improve roadway safety, this move reduces the available driver pool and could contribute to higher transportation costs if freight demand tightens.
All of this contributes to a system that still functions, but with more friction. Costs are higher, schedules are less predictable, and variability is increasing. That variability matters because construction schedules depend on coordination. Materials arriving late or inconsistently can disrupt sequencing, extend timelines, and increase costs in ways that go beyond transportation itself.
So, while logistics is not broken, it is operating under sustained pressure—and that pressure is being passed directly through to projects.34
Initially reported average flatbed contract rates, excluding fuel, edged higher by 0.3% MoM in January but remained 0.3% below levels recorded in the same month last year. Continued volatility in the spot market further narrowed the gap relative to contract rates, with the contract-to-spot spread declining from 18.4% in February to 14.5% in March.
Flatbed market strength persisted in March, with average linehaul spot rates increasing for a fourth consecutive month, rising 5.4% MoM, or $0.12, to $2.35. This sustained momentum has lifted flatbed spot rates 13.7% above year-ago levels and 13.3% above the long-term average, while on an all-in basis, including fuel, rates increased 13.2% MoM and were approximately 22% higher YoY versus March 2025.
Source: April 2026 Industry Update: Flatbed | Ryan Transportation accessed on May 4, 2026
There have been increases in the flatbed market, but the 21% premium continues to make the spot market attractive to customers with inconsistent lanes.
Continue to bid level the spot market when volume does not make it cost competitive for contract rates.
For the first 16 weeks of 2026, U.S. railroads reported a cumulative volume of 3,602,594 carloads, up 3.5 percent from the same point last year; and 4,414,204 intermodal units, up 0.2 percent from last year. Total combined U.S. traffic for the first 16 weeks of 2026 was 8,016,798 carloads and intermodal units; an increase of 1.7 percent compared to last year.
The Rail industry made slight gains. However, tariffs in the commercial market will cause less containers and intermodal port use.
Use rail for heavy items which require cheaper per mile costs, flexibility in delivery and short distance from intermodal facilities.
Source: https://www.aar.org/news/aar-reports-weekly-rail-traffic-for-the-week-ending-april-25-2026 accessed on May 4, 2026
Increased fuel costs from the Strait of Hormuz closure continue to keep container costs elevated. Transpacific carriers have been steadily pushing rates up and preventing backsliding since late February. Prices ticked up slightly for both coasts last week, with West Coast rates of $2,675/FEU up 45% compared to the start of the war and almost 90% higher than post-peak season levels back in October. East Coast prices at just below $4,000/FEU are 30% higher compared to just before the war, and 30% above the previous low-demand stretch in October.
With elevated fuel prices expecting continued higher rates, carriers will continue to blank a significant number of sailings to ensure prices remain stable.
Continue to look at the spot markets. Project Teams and Owners should pay attention to shipping schedules to ensure products arrive in time for installation or to be able to mitigate risks to construction timelines.
Source: Freightos Weekly Update email dated April 28, 2026. Accessed on May 4, 2026
In many cases, risk does not start when materials are ordered—it starts much earlier, during design and planning. Supply chain problems increasingly emerge far upstream of procurement, reinforcing the importance of early engineering engagement, flexible design decisions, and scenario planning.35
Decisions made during design and planning—material selection, sourcing strategy, supplier engagement, and timing—have a much higher impact on cost and flexibility. Once those decisions are locked in, options narrow quickly.
Understanding where materials come from, how they move, and what risks they are exposed to allows for better decisions before those risks become costs. It also allows for more flexibility. When alternatives are considered early—whether different materials, different suppliers, or different sourcing strategies—projects are better positioned to adapt to changing conditions instead of absorbing them passively.
Industry guidance suggests preparing for at least 12 months of continued transportation disruption, with potential freight rate increases approaching 40% once fuel, war-risk, and emergency surcharges are layered in.36 That is an important forecasting signal because it sets a planning horizon. It suggests that current logistics disruption is not a short-lived event likely to normalize immediately. Rather, it should be treated as an operating condition, not a temporary anomaly.
Traditional supply chain concerns—like availability and pricing—are now joined by broader factors such as geopolitical fragmentation, extreme weather intensification, aging infrastructure, and rising cyber threats targeting logistics networks.37 In several assessments, geopolitical fragmentation emerges as the most significant threat to supply chain stability, followed by these other operational and systemic risks. These risks are less predictable and often harder to manage because they do not originate from a single market condition or supplier issue. They arise from the structure of the system itself.
That complexity makes it increasingly difficult to rely on manual processes alone. Managing this environment exceeds the capacity of spreadsheet-only tracking and reactive communication. Data, analytics, and emerging technologies like AI are becoming necessary tools for understanding and responding to change.38 Their value is not in eliminating uncertainty, but in helping teams process more information, see patterns sooner, identify exposure more clearly, and make better decisions in time to make an impact.
The practical implication is that supply chain management is becoming less about chasing late-stage fixes and more about building resilient decision-making earlier in the project lifecycle. Projects that engage sooner, map supplier exposure, understand logistics conditions, scrutinize surcharges, and communicate risks early are better positioned to protect cost and schedule.
DPR’s approach is built around this shift—integrating design, procurement, and construction early to create upstream visibility into suppliers, markets, and logistics, and embedding procurement strategy directly into project decisions.
By leveraging supplier relationships, real-time intelligence, and early trade partner engagement, teams can anticipate risks, address long-lead constraints, and evaluate trade-offs before they impact execution. This positions supply chain not as a downstream function, but as an early driver of cost, schedule, and overall project certainty.
In today’s market, supply chain management is no longer a downstream function—it is a strategic lever embedded in how projects are designed and delivered.
And customers who partner with DPR gain more than a builder—they gain a team equipped to navigate complexity, make informed decisions early, and deliver with confidence when it matters most.
Supply Chain Generalist
Construction disruptions rarely arrive all at once. They surface gradually—one supplier notice, one lead-time adjustment, one pricing change at a time. Historically, those signals were scattered across inboxes and often only became visible once the impact was already locked into a project.
That reality began to come into focus in 2020, during the early stages of COVID recovery. Global manufacturing shutdowns had created widespread volatility, and as factories slowly restarted, demand surged across industries. Shortages began affecting both price and timing. At first, each notice seemed manageable on its own. But together, they pointed to something much larger.
Supply Chain Leader, Tim Jed, recalls,
We started getting these letters in September. We didn’t have a good way to communicate this to our teams. We didn’t even have a good way to see it. When you start receiving multiple notices from the same vendor, that’s a signal of capacity stress. If you wait until they start canceling orders, it’s already too late.
That moment exposed a gap—not just in process, but in visibility. Teams weren’t lacking information; they were lacking context. Supplier impacts were real, but they were isolated, arriving one at a time, without a way to understand their collective meaning or act early.
Out of that urgency came a shift in how supplier impacts are viewed today. Instead of living in individual inboxes, notices are surfaced together, allowing patterns to emerge. What once felt like noise now functions as an early warning system.
That change fundamentally altered how teams engage with risk. Rather than reacting downstream, teams now have time. They have time to adjust strategies, accelerate purchases, re-sequence work, or explore alternatives while options still exist. Conversations shift from isolated decision-making to shared understanding, grounded in a clearer picture of what the market is signaling.
This visibility has become especially important over the past year as tariff-related market shifts have driven changes in material pricing and lead times. Owners and jobsite teams have asked how global tariff changes might translate into construction costs. In response, our dashboards were advanced to include a Tariff Related Impacts view, helping teams connect macroeconomic shifts to practical, project-level insight.
The tool doesn’t predict the future, but it does something essential: it highlights signals early enough to act. The further upstream those signals are captured, the more flexibility teams have to manage outcomes instead of absorbing disruption.
That idea mirrors a truth captured long before dashboards existed. In her poem “Little Things,” American poet Julia Fletcher Carney wrote:
Little drops of water, little grains of sand,
Make the mighty ocean and the pleasant land.
A single supplier letter is one of those drops. On its own, it rarely changes a plan. But when many are seen together, they form a current—revealing stress points, emerging trends, and opportunities to respond before disruption become unavoidable.
Seen collectively, those small signals create leverage. They allow teams to prioritize partnerships, plan more predictably, and in some cases even influence vendor behavior. The power isn’t in any one notice—it’s in what becomes visible when they’re viewed together.

Investment in Advanced Manufacturing and Mission Critical continues to define U.S. industrial growth heading into 2026.

Check out our current conditions interactive dashboard.
Information in this report is compiled from third-party reporting that is available to the public. It is not owned by DPR Construction.
As of May 15, 2026, the content in this section reflects the most current market data available. Given the dynamic nature of the global market, changes occur daily. For the latest updates and insights, please consult your local DPR contact.
United States Census Bureau
United States Department of Labor
United States Energy Information Administration
United States Chamber of Commerce
United States Bureau of Labor Statistics
Engineering News Record
American Institute of Architects
Cumming Corporation
2 CummingGroup_Q4_2025_MarketingAnalysis.pdf
3 Construction Outlook What’s in the Mix for ’26—and Beyond, Ken Simonson, Chief Economist, AGG, March 2026
6 Spending trends mix of increases and decreases, Ken Simonson, Chief Economist, AGC, March 2026
7 Asian Manufacturing Takes Off While North America Contracts | GEP
8 2025 Tariffs - What’s New & What to Know, Frank Brady, CH Robinson, 2026-03-11
9 Trump’s latest 10% tariffs found unlawful by U.S. trade court - Los Angeles Times
10 The Transatlantic Economy 2026 | U.S. Chamber of Commerce
11 IEEPA Tariff Ruling - market conditions update, Tariffs Item_1_IEPA_Tariff_Ruling_Executive_Summary
12 2025 Tariffs - What’s New & What to Know, Frank Brady, CH Robinson, 2026
13 Iran War Supply Chain Impact
15 WTI
18 UAE quits OPEC in blow to cartel that could reshape global oil markets
19 Middle East Conflict Drives Raw Material Shortages and Supply Disruptions - Everstream Analytics
20 Aluminum
21 Nickel (sulfur from middle east to Indonesia who produces 75% of world nickel)
22 DPR Forecast Dashboards
24 Unintended Consequences of the Iran War on the US Steel Market, Staalx email, 2026-03-30
25 Copper
26 Middle East Conflict Causes Fuel, Chemical and Fertilizer Shortages - Everstream Analytics, Ohara & Sons Update - forecast and business update, Luke Coleman, Oharasson, 2026-03-12
27 US to build largest aluminum plant with 500,000-ton annual capacity
28 2026_Q1-Market-Conditions-Report.pdf, GLE building $1.8B Kentucky uranium enrichment facility
29 U.S.-Japan Alliance: Record Investment and Trade Deals | U.S. Chamber of Commerce, U.S.-Brazil Forum on Critical Minerals: Growing the Partnership on Strategic Supply Chains | U.S. Chamber of Commerce, US, EU deepen cooperation on critical minerals with eye to broader agreement
30 April 2026 Edge Report, CH Robinson
31 Middle East Military Action Impacting Global Transportation, Frank Brady, Strategic Sales, CH Robinson - Updated 03/26/2026
32 March 2026 Industry Update | Ryan Transportation
34 February 2026 Industry Update: Flatbed | Ryan Transportation | AAR Reports Weekly Rail Traffic for the Week Ending February 14, 2026 | Freightos Weekly Update email dated February 17, 2026
35 The best supply chain strategy isn’t a supply chain strategy - Fast Company
36 The Iran Conflict Requires CSCOs to take action immediately, Gartner, 2026-03-02
37 2026 Annual Supply Chain Risk Report, Everstream Analytics
38 Sociable: Meta outlines AI benefits for US construction industry | Construction Dive
Photos: Lionel Branscomb, Danny Sandler and DPR staff.

National Preconstruction Leader

Posted on May 20, 2026
Last Updated May 22, 2026
File Download


