


Stories
by Tim Jed and Roel Aguilar 39 minute read
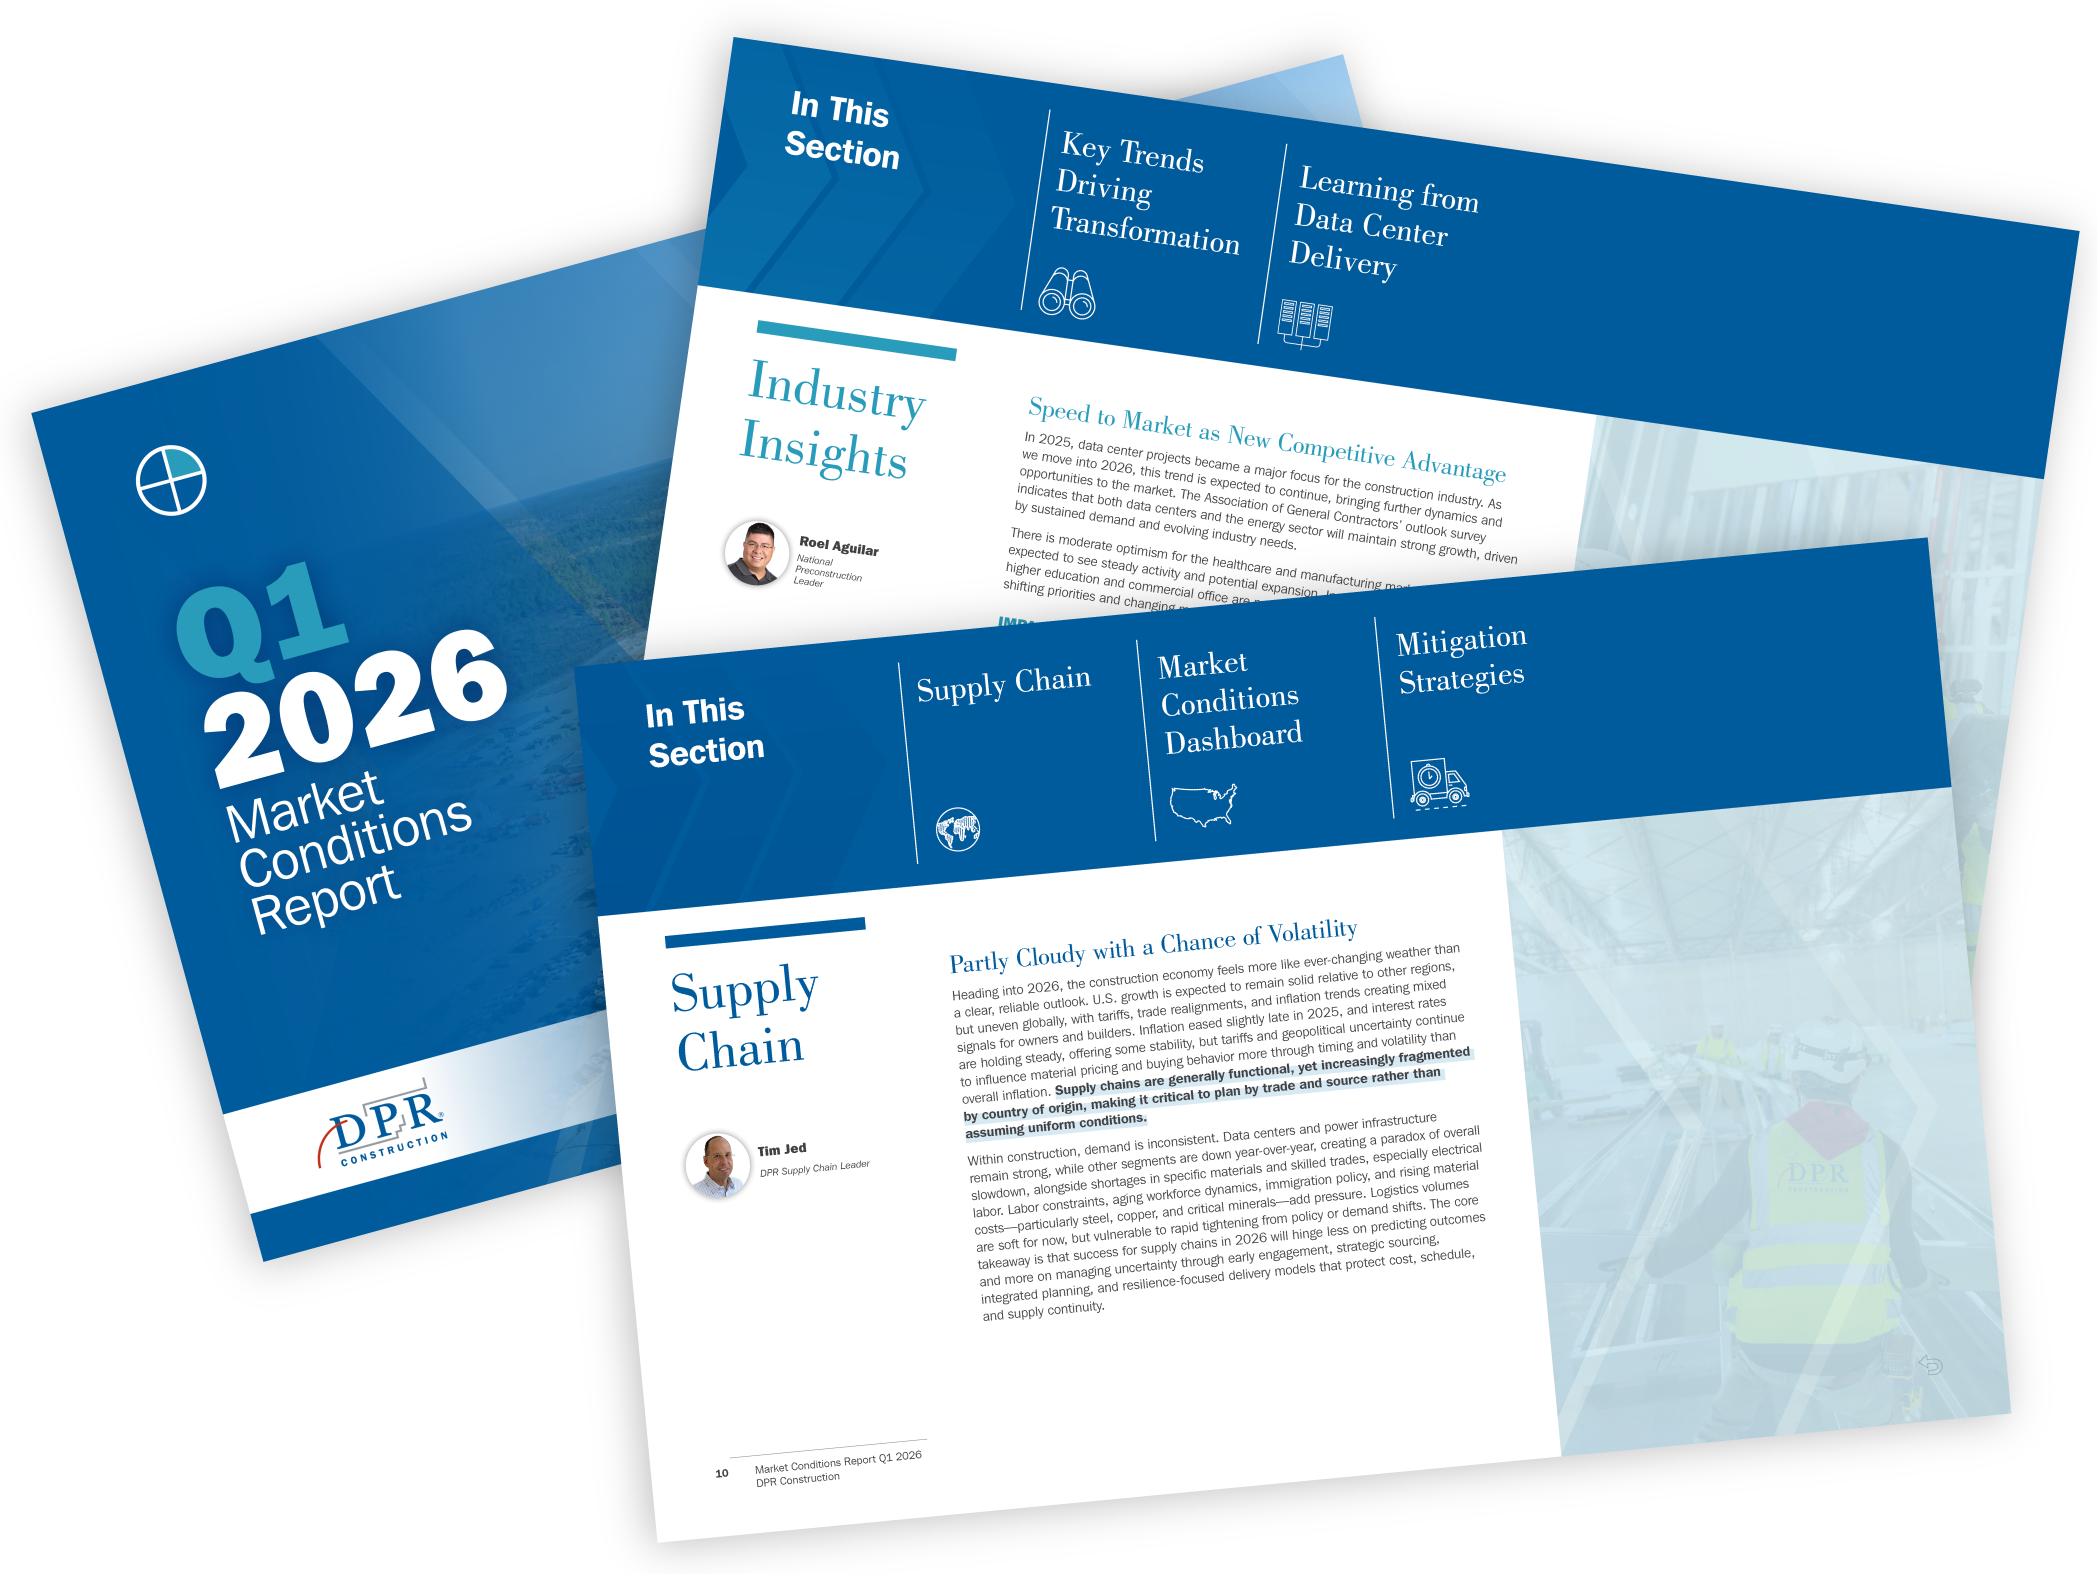
Our Q1 2026 Market Conditions report summarizes current market conditions, industry trends, and mitigation strategies to make more informed business decisions in the quickly changing construction landscape.
In 2025, data center projects became a major focus for the construction industry. As we move into 2026, this trend is expected to continue, bringing further dynamics and opportunities to the market. The Association of General Contractors’ outlook survey indicates that both data centers and the energy sector will maintain strong growth, driven by sustained demand and evolving industry needs.
There is moderate optimism for the healthcare and manufacturing markets, which are expected to see steady activity and potential expansion. In contrast, sectors such as higher education and commercial office are projected to decline in 2026, reflecting shifting priorities and changing market conditions.
The U.S. construction industry has seen rapid growth in data center projects, driven by the growth of hyperscale facilities and the increasing influence of artificial intelligence. Deloitte estimates that by 2035, power demand from AI-driven data centers could increase more than thirtyfold. As a result, Owners are shifting from traditional cost-focused strategies to prioritizing speed to market, as faster delivery directly correlates with greater revenue and competitive advantage.
AI is also reshaping how results are delivered across the industry. Its impact extends beyond mission-critical projects, and other sectors should consider adopting many of the approaches emerging from data center construction. As these approaches gain traction, they will fundamentally change how projects are planned, procured, and executed across the broader construction market. The following are some key drivers that data center building could impact other key markets.

Establishing strategic partnerships at the outset of a project is essential for reshaping procurement processes and rethinking planning approaches. By engaging key stakeholders from the beginning, organizations can create more agile and innovative project delivery methods that respond quickly to evolving market demands.
A scenario where the steel mill is actively involved before the steel fabricator or erector begins their work highlights a strategic shift in project delivery. By fostering collaboration between the steel mill, structural engineer, and fabricators at the earliest design stage, project teams can realize substantial improvements in delivery speed and overall efficiency. The emphasis is not on bypassing intermediaries, but rather on integrating contractors and steel fabricators as essential contributors from the very beginning of the planning process.
This integrated approach ensures that critical partners are deeply involved in both the design and delivery phases, streamlining communication and decision-making. As a result, project timelines are accelerated, and efficiency is enhanced throughout the construction process.
An illustrative example of these principles in action is the Abilene Data Center Project in Texas. The project team identified the need to enclose the structural steel buildings as quickly as possible, prompting a shift in typical workflows. Structural engineering firm GPLA was tasked with delivering initial structural designs for steel mill orders within just two weeks, followed by complete detailed structural and fabrication models in under six weeks. This rapid turnaround required early and direct partnership with the steel mill and fabricators.
By engaging these key players from the outset, the team was able to bring steel onsite much more efficiently, as opposed to the traditional process of finalizing designs before seeking pricing and production from fabricators. The proactive collaboration and early integration of all critical participants proved essential to achieving faster delivery and more effective project execution.
Establishing direct partnerships with leading mechanical and electrical manufacturers such as Square D, Cummins' Carrier, and Trane can significantly enhance project outcomes. By involving these manufacturers from the earliest stages of planning, design, and procurement, and engaging them as sole sources, project teams gain access to their specialized insights and expertise. This approach moves away from conventional procurement models like bid-build or design-build, instead positioning manufacturers as integral contributors from the project’s inception. Collaborating with manufacturers throughout the planning process, rather than limiting their role to procurement, fosters the development of innovative and effective solutions.
In addition to manufacturers, the early involvement of electrical and mechanical trade partners is crucial for the successful identification, procurement, sequencing, and installation of key MEP components. Engaging these partners at the outset ensures that all aspects of mechanical, electrical, and plumbing systems are efficiently coordinated. Furthermore, including rigging contractors early in the process is essential for planning the movement and installation of large equipment and MEP skids. This proactive coordination between manufacturers, trade partners, and rigging contractors is fundamental to achieving timely and successful project delivery.
In today’s fast-paced construction environment, the traditional integrated delivery approach, while effective in the past, requires significant adaptation to meet current demands. Success depends on architects and engineers engaging in daily, and often more frequent, collaboration with project teams. This engagement extends beyond basic coordination; it involves active participation with field operations, estimating teams, trade partners, schedulers, and virtual design and construction professionals. The goal is to orchestrate the design process in a truly transformative manner.
To achieve this, organizational silos must be dismantled and conventional workflows reimagined. Communication must accelerate within the RFI management process, for example, shifting from the old standard of waiting for responses to RFIs or design questions to a dynamic, near real-time exchange of information. The emphasis is on building trust in the collaborative process and working together to reduce downtime associated with information requests.
Equally important is recognizing that the production of design deliverables is as critical as timely responses to field questions. This environment demands a hyper-speed level of optimization not typically seen in traditional design-build practices, with the objective of minimizing delays and maximizing efficiency throughout the project lifecycle.
Successfully implementing strategic partnerships and advanced project delivery methods relies on establishing a strong foundation of trust among all stakeholders. This trust is built through a commitment to innovative, forward-thinking strategies and the willingness to challenge and improve upon traditional practices.
To accelerate project delivery and ensure high-quality outcomes, it is essential to form collaborative teams at the earliest possible stage. Early engagement allows for prompt sharing of information, which is critical for effective planning and decision-making. By involving all relevant parties from the outset, teams are better positioned to identify opportunities, address challenges proactively, and streamline project workflows.
Developing partnerships that prioritize speed and excellence in project execution requires that all participants share common goals and demonstrate a readiness to reconsider established norms. Open communication channels and ongoing collaboration are at the heart of this process, ensuring that every team member remains aligned and fully committed to achieving accelerated timelines and exceptional results. This collective investment in shared objectives is the cornerstone of successful strategic project delivery.

A proactive approach to supply chain management is essential for accelerating project delivery and making well-informed prefabrication decisions. By prioritizing early supply chain analysis, project teams gain a clear understanding of material sources and manufacturing processes, which enables them to identify risks and opportunities from the outset. This early awareness ensures that materials and components are secured efficiently, supporting faster project timelines and minimizing potential delays.
The construction industry routinely contends with challenges such as tariffs, inflation, permitting delays, and geopolitical instability. In this environment, speed becomes a critical factor for meeting client expectations and delivering projects ahead of schedule. Mistakes or oversights in procurement can significantly impact speed to market, so it is vital to maintain a focus on the end result throughout the planning process. Every aspect of the building from site requirements, structural elements, enclosure and roofing systems, and MEP critical equipment must be considered from the beginning. Sourcing must begin before finalizing design decisions, with a thorough understanding of every component being reverse engineered back to its source. This approach represents the standard for delivering projects at an accelerated pace.
Supply chain strategies along with procurement are not merely a process that follows iterative design; rather, it is an integral part of defining what is to be built. Understanding material constraints early on allows teams to assess how modularization and prefabrication can be leveraged. Prefabricating mechanical and electrical skids, for example, can save significant time during onsite installation and improve overall product quality. Solutions such as strut systems, mechanical rack systems, and prefabricated exterior enclosures are effective in reducing both installation time and inefficiencies. Even simple innovations, such as prefabricated rebar grid systems, can vastly increase production speed compared to traditional loose rebar that must be manually tied down by more workers over longer periods.
Modular and Prefabrication delivery is no longer an innovation – It’s just “the way.” Transformational thinking about supply chain and procurement strategies, combined with the prioritization of modular and prefabricated systems as a standard practice rather than an optional solution, is fundamental to achieving fast project delivery. Embracing these approaches enables project teams to streamline operations and respond more effectively to industry challenges, ensuring projects are completed rapidly and to high standards.

Integrating Building Information Modeling (BIM) and digital twins as foundational elements of project delivery is crucial for achieving speed and efficiency in today’s data center construction landscape. While BIM and digital twins are established tools within the industry, their role should be elevated from supplementary aids to strategic drivers of planning, execution, and operational performance. These technologies offer advanced visualization capabilities, facilitate improved coordination among stakeholders, and generate actionable, data-driven insights with each supporting informed decision-making throughout the project lifecycle.
Maintaining an accurate, clash-free model is essential, ensuring the model leads the design process rather than merely reacting to changes. This is particularly critical when managing the complex requirements of fire protection, electrical systems, intricate cabling, and advanced cooling systems that rely on water-cooled solutions. Having a robust model early in the project allows teams to evaluate buildability, as well as energy and water consumption, helping them satisfy regulatory, environmental, and technical requirements well before construction begins. Virtual planning provides a clear understanding of project execution in the field, enabling better preparation and reducing unforeseen challenges.
Co‑locating VDC and A/E teams together in the same room enables the close collaboration needed for virtual constructability to strengthen design, and for design to better inform constructability. This proactive modeling approach accelerates project delivery, especially as complexity increases. Dependence on manual workflows can slow down decision-making processes; therefore, it is imperative to maintain precise and continually updated models to ensure predictability and project success.
Equipping Virtual Design and Construction (VDC) teams with high-quality data at the earliest design stages empowers them to quickly adapt to evolving system and engineering requirements. Early engagement in design and installation modeling within a virtual environment is vital for supporting the demands of prefabricated and modular construction. These early modeling efforts not only enhance the efficiency of on-site work but also minimize construction impacts and disruptions.
Ultimately, embracing this optimized workflow enables project teams to maintain the flexibility required for timely project delivery and to effectively meet the escalating demands of the data center industry. In today’s rapid-paced environment, mature BIM practices are essential for sustaining productivity and quality. Digital project delivery is no longer optional for accelerated schedules; it must be central to both design and execution strategies.

In today’s fast-paced data center construction landscape, clients must adopt flexible mindsets and remain open to fundamentally new project delivery methods. This flexibility means being willing to modify plans and processes in response to shifting market conditions, advances in technology, and evolving client requirements. Such adaptability is crucial for maintaining competitiveness as the industry continues to evolve rapidly.
Traditional design-bid-build approaches often fall short in meeting aggressive schedule expectations, especially given the substantial investment flowing into data center projects. The heightened risk associated with mega projects opens the door to contracting strategies that permit multiple prime contractors on a single project. This shift from a single prime contractor to multiple primes enables greater accountability and fosters risk sharing among all parties involved. Collaborative teaming agreements allow these prime contractors to work together effectively, even when their contracts with the client are independent. The result is a collaborative environment where risks are distributed among the primes, benefiting all stakeholders and placing collaboration at the forefront of project execution.
The relationship between suppliers, manufacturers, and project owners is also evolving. Suppliers and manufacturers are now negotiating more aggressive and accelerated payment schedules. Unlike the traditional model, where suppliers assumed risk by waiting for payment or extending credit until delivery, the current approach favors upfront payments and expedited payment terms. Owners and lenders are increasingly accepting these changes to mitigate risks associated with delays in critical equipment and materials.
The financial frameworks supporting these projects are also evolving, with multiple lenders often involved and innovative blends of real estate and project finance. This creativity in structuring financing arrangements supports the flexibility needed to manage risk and speed in data center construction.
The data center sector has effectively become the construction industry’s proving ground for speed, integration, and disciplined execution. The relentless demand for capacity, which is driven by hyperscale growth and AI has forced owners, designers, contractors, manufacturers, and financiers to abandon sequential, risk-averse delivery models in favor of deeply collaborative approaches. Early strategic partnerships, proactive supply chain engagement, prefabrication as a default strategy, and BIM-led execution are no longer “best practices” in data center work. They are prerequisites for success. Speed to market has emerged as the dominant competitive advantage, redefining how value is created and measured across the project lifecycle.
Other sectors like healthcare, commercial, life sciences, and even select institutional markets stand to benefit significantly by adopting these same principles. While their drivers may differ, the lessons are universal: engage critical partners earlier, design with procurement and constructability in mind, leverage prefabrication and digital delivery to reduce uncertainty, and align contracts and financial structures to support speed and shared risk.
Data center work demonstrates that when teams commit to trust, transparency, and execution velocity, outcomes improve not just in schedule, but in quality, predictability, and long-term performance. As market pressures intensify across all sectors, the data center playbook offers a clear roadmap for how the broader construction industry can evolve and win in 2026 and beyond.
Heading into 2026, the construction economy feels more like ever-changing weather than a clear, reliable outlook. U.S. growth is expected to remain solid relative to other regions, but uneven globally, with tariffs, trade realignments, and inflation trends creating mixed signals for owners and builders. Inflation eased slightly late in 2025, and interest rates are holding steady, offering some stability, but tariffs and geopolitical uncertainty continue to influence material pricing and buying behavior more through timing and volatility than overall inflation. Supply chains are generally functional, yet increasingly fragmented by country of origin, making it critical to plan by trade and source rather than assuming uniform conditions.
Within construction, demand is inconsistent. Data centers and power infrastructure remain strong, while other segments are down year-over-year, creating a paradox of overall slowdown, alongside shortages in specific materials and skilled trades, especially electrical labor. Labor constraints, aging workforce dynamics, immigration policy, and rising material costs—particularly steel, aluminum and copper, and critical minerals—add pressure. Logistics volumes are soft for now, but vulnerable to rapid tightening from policy or demand shifts. The core takeaway is that success for supply chains in 2026 will hinge less on predicting outcomes and more on managing uncertainty through early engagement, strategic sourcing, integrated planning, and resilience-focused delivery models that protect cost, schedule, and supply continuity.
For 2026 planning, the economic environment functions more like a set of shifting weather systems than a predictable, single forecast. Several forces are moving at the same time, sometimes reinforcing each other and sometimes pulling in different directions. For planning purposes, the goal is not to identify a single “right” forecast, but to understand what is supporting growth, what is putting pressure on it, and which signals are most likely to affect construction and supply chain decisions over the next 6 to 18 months. In other words, how’s the economy, what’s pricing going to do, what’s up with inflation, and can we rely on our supply chains?
Goldman Sachs projects an optimistic outlook for the U.S. economy in 2026 at 2.6% growth in GDP for the U.S., citing drivers like tax cuts, improved financial conditions, and reduced tariff drag. Their forecast is more optimistic than others, like the Congressional Budget Office, which is projecting slower growth at 2.2%. But in both cases, these numbers are higher than their internal 2025 estimated year-end finish.1,2
At the global level, even though growth is expected to remain roughly stable, it is still uneven depending on the country. Even with all the tariffs affecting China’s goods, its manufacturing sector is expected to post robust growth, while much of the country’s domestic economy remains weak. The EU is projected to be flat overall, with gains in Germany, Spain, and other parts of Southern Europe offset by weakness elsewhere. The broad view is that global growth holds steady with the U.S. outperforming most other countries.3 This matters because it could influence expectations around capital spending and the willingness of owners to move projects forward.
But under the pressure of U.S. tariffs, global talks are driving changes to world trade, shifting partners away from the U.S. In January 2026, after 25 years of stalled negotiations, the EU approved a free trade agreement with Brazil, Argentina, Paraguay, and Uruguay. If ratified, it would create one of the world’s largest free trade zones by population.4 North of the border, Canada has announced they plan to grow non-U.S. trade by 50% over the next 10 years,5 and the recent comments by the U.S. Administration challenging the relevance and need of the trade agreement between the U.S., Canada, and Mexico6 could further increase costs if this agreement is allowed to expire (The USMCA). These shifts could affect the U.S., not just economically, but also in terms of influence on how worldwide policies and practices are designed, structured, and administered, creating other unintended hurdles for the U.S.
Layered on top of the growth outlook, inflation remains one of the most important day-to-day drivers for construction because it shapes affordability and predictability of costs, and potentially, project viability. Initially, after some post-tariff increases, the inflation data provided shows a recent drop, from 3.0% in September 2025 to 2.4% in January,7 with AGC reporting December PPI inputs to new nonresidential construction increasing 3.3% year-over-year.8 Although inflation remains above the Fed’s 2% target, should this trend continue, it could help to calm fears that tariffs will automatically drive broad price increases. Studies show that we should see most of the effect of current tariffs in our pricing by the end of the first half of 2026.9

(Source: Goldman)
These intricacies have The Fed proceeding with caution regarding easing the lending rate. The last rate cut was 0.25% on December 11, 2025, with no changes since.10 The Fed is neither accelerating cuts nor tightening further based on the current environment, but if inflation continues to level off or fall, we anticipate continued cuts in rates. And while rate cuts would be welcome, “stable but uneven” growth produces mixed effects, even if inflation and the lending rates improve.
Although world trade alliances are shifting, demand for many products is strong, so some countries may stay busy, while others may have excess manufacturing or shipping capacity. This imbalance can show up as cost increases or delays for products from certain countries, while other countries may have improved pricing and lead times for those same products. And, since it can be complicated to shift supply chains, it could take a while to adapt.
For construction, the implication is relatively straightforward, even if solving the issue is complex: plan for variability by trade category and country of origin rather than assuming a single effect applies everywhere. It’s a cautious optimism paired with risk management—supply chains need to be managed with the assumption that volatility can return suddenly.
Construction activity in this cycle does not behave like a single market, even though it often gets discussed that way. Instead, it looks like a collection of markets that share some trades and materials but respond to very different demand drivers. The data makes that clear: some segments are down, one is strongly up, and leading indicators send mixed signals depending on where you look.
That uneven backdrop shows clearly in the spending data. Manufacturing construction is down 1% from July 2025 and down 8.5% year-over-year (August 2024 to August 2025). Commercial construction is flat month-over-month but down 8.9% year-over-year. Data centers stand apart, with spending up 26% year-over-year over the same period.11
This divergence has real implications. An overall slowdown can coexist with shortages in specific equipment and trades. Data center projects are power- and electrical-intensive, concentrating demand on switchgear, generators, cabling, UPS systems, controls, and commissioning expertise. Even if other commercial segments soften, strong data center demand can keep key inputs constrained for these products and specialty labor.
Beyond spending alone, design activity adds another layer of nuance. The Architectural Billings Index hovered below 50 for most of 2025, signaling contraction. Inquiries increased, but billings declined between October and November. That combination points to interest that is not yet translating to active projects, with owners exploring feasibility, early budgets, and concepts.12 For contractors, this environment often means heavier preconstruction effort and fewer awards. It can also drive tighter budgets, which can drive more risk transfer when projects do move forward.
Industry outlook survey results reinforce that picture. Firms expect demand in 2026 to continue to favor data centers and power projects, while reporting elevated economic and policy uncertainty. Tariffs, immigration enforcement, and difficulty finding qualified workers rank as top concerns, alongside material costs and recession risk.13
The takeaway is a market that is not universally short on demand but widely affected by uncertainty. Even in growth sectors, that uncertainty changes buying behavior. Owners may accelerate long-lead procurement or delay awards while waiting for policy clarity, while contractors may tighten terms, increase contingencies, or favor certain projects over others.
Labor remains central to the discussion. The civilian unemployment rate stood at 4.4% for December, slightly lower than November, but generally increasing since hitting a 5-year low in the spring of 2023. However, in construction, this does not signal a slack labor market, especially for specialized skilled trades, like electricians needed for data center construction.14
At the same time, alternative forecasts outline a riskier path. Economist David Rosenberg expects unemployment to rise toward 5% and potentially 6% by year-end, paired with deeper rate cuts than official forecasts anticipate. His view ties labor market contraction to recession risk and notes that rate cuts do not automatically restore employment.15
But even if Rosenberg’s unemployment projections are correct, if unemployment rises, labor relief is unlikely to appear evenly for construction, and administration policy uncertainty and immigration enforcement are additional variables that complicate the issue.
In our 2025 Q3 DPR Market Conditions Report, we noted that foreign-born workers make up a significant share of construction craft labor, exceeding half of the workforce in many trades. If those labor channels tighten, impacts will vary by region and trade, showing up as wage pressure, schedule risk, and subcontractor availability challenges into 2026 and beyond.16
Longer-term workforce dynamics may amplify this risk. In 2024, the U.S. recorded about 3.63 million births, while the birth rate remained near 1.6, well below replacement levels of 2.1. Construction is especially exposed because it has an aging skilled labor base. Federal Reserve research shows that without immigration, prime-age labor force growth would slow further and eventually turn negative,17 which could lower GDP and lead to further funding pressures for programs like Social Security and Medicare.
Geopolitics plays a direct role in the supply chain. Even though we think of construction as ‘local’ craft-built projects, most materials contain raw materials, chemicals, components, or other products that come from other countries, even when final products are domestically assembled. U.S. policy on tariffs and other global factors can move pricing, availability, and supplier behavior, with compounding effects from domestic events like strikes, logistical backups, accidents, and weather.
From a cost standpoint, the Producer Price Index for non-residential construction materials rose 0.4% in November and 3.6% over the prior 12 months, the largest increase since January 2023. Materials are pushing costs upward even as some supply chain indicators improve, like GEP’s Supply Chain Volatility Index, which shows easing of the supply chain.18,19,20 And our recent supplier interviews tell us that lead times are not increasing, even as prices rise.21 One example, we have recently been advised of pending increases in paint and coatings, due to higher raw material demand, while lead times should remain stable.

+ = supply chain capacity stretched – = supply chain capacity underutilized
(Sources: GEP, S&P Global PMI)
The most significant impacts over the last year have been in steel-related categories, including cold-formed metal framing, hot-rolled coil, structural steel, and metal suspension systems. These increases are closely tied to tariffs.22
Copper has also had a significant surge in pricing due to tariffs. Prices reached record highs above $13,000 per ton on the London Metal Exchange, up roughly 20% since mid-November. Drivers include new U.S. tariffs introduced in August 2025, which triggered a rush to import copper to the U.S., along with supply disruptions from a strike in Chile, a fatal accident at the world’s second largest copper mine in Indonesia, and flooding in a Congolese mine.23
For construction, copper’s role in wiring, bus duct, transformers, and power equipment makes this especially relevant as demand shifts toward data centers and power projects.24 Rapid copper escalation often shortens quote validity windows and increases escalation risk across multiple tiers of the supply chain.
Copper is not alone. Other metals send similar signals. Aluminum trended upward through 2025, still below its mid-2022 peak, but moving higher.25 Precious metals reached all-time highs, driven by expected rate cuts, global uncertainty, and increased physical buying by India and China,26 impacting certain products like electronic and mechanical systems or components that require these materials. China’s export restrictions now include silver,27 alongside tungsten and antimony. And now precious metals are bleeding into critical minerals policy, with silver added to the U.S. critical minerals list in 2025 due to its role in electrification, clean energy, and data centers.28
In past DPR Market Conditions Reports, we shared several strategic U.S. moves to improve supply of critical materials. Those efforts continue, as evidenced by recent news in which Ionic Rare Earths Limited signed a memorandum of understanding with U.S. Strategic Metals to develop a vertically integrated rare earth production site in Missouri, targeting materials such as neodymium, praseodymium, dysprosium, and terbium.29 These initiatives take time but signal a shift away from single-country dependence. The U.S. is also delaying assessing new tariffs for imported critical minerals in favor of international agreements to secure competitive supply.30
Shipping and trade risks add another layer of nuance. Tensions in the Taiwan Strait increased after China conducted war games and missile tests in late December, underscoring a potential risk to a critical global shipping lane and global semiconductor hub.31 China’s plan to introduce steel export licensing beginning January 2026 could further alter global supply flows and pricing even without outright shortages.32
Did You Know?
This was a steep increase from 2024 when USMCA imports from Mexico and Canada were about 48% and 37%, compared to 76% and 78% for 2025, respectively. The increase in USMCA-compliant trade can be attributed to importers and exporters trying to leverage the agreement to avoid country-specific IEEPA tariffs. (Source: S&P Global)
In North America, the scheduled July 2026 USMCA (the United States-Mexico-Canada Agreement for trade) review introduces another inflection point, with outcomes ranging from renewal to renegotiation or termination, each carrying different pricing implications.33,34
As noted earlier, the U.S. Administration is not signaling that it sees value in this agreement. Based on spend, for the first half of 2025, roughly 76% of U.S. imports from Mexico and 78% of U.S. imports from Canada entered duty-free under the USMCA. Non-renewal of USMCA would end those protections, and duties would increase 35% for Canada and 25% for Mexico.35
Additionally, Mexico imposed tariffs on their imports for countries where no trade agreements are in place,36 potentially raising U.S. costs for goods manufactured there (even those protected under the USMCA), as higher prices for materials imported to Mexico will raise production costs containing those materials, which would then translate to higher prices.
Tariffs show up not just as a line-item cost, but as a force that can reshape buying behavior and timing by shifting where and when manufacturers buy materials. Beyond raising landed costs, tariff uncertainty changes ordering patterns and can create short-term instability in freight and availability.
A recent example is the extension of tariffs on upholstered furniture, kitchen cabinets, and vanities. A White House fact sheet from December delayed further increases for one year while keeping the existing 25% tariff in place.37 This has likely affected manufacturers’ decision of manufacture location, driving significant work by their supply chain teams, or may have affected projects that purchased material early to avoid these additional duties, affecting cash flow and inventory carry costs for interior-heavy projects.
Section 301 Investigation, China, Technology Transfer, Intellectual Property, and Innovation
This investigation found that China’s policies promote the transfer of U.S. technology and IP to Chinese firms, harming U.S. exports, jobs, innovation, and overall economic interests. (Source: ustr.gov)
Semiconductor tariffs provide a longer-horizon signal. Additional tariffs beginning in June 2027 will stack on an existing 50% levy following a Section 301 investigation into China’s semiconductor policies.38 Even with a later start date, these actions influence supplier expectations and owner decisions today, particularly for technology-driven facilities like data centers.
Tariff uncertainty has been compounded by spontaneous announcements, including threatened measures tied to Iran and Greenland. The Administration announced a 25% tariff on countries doing business with Iran, potentially pushing China’s total levies above 70%, and an additional 10% tariff on several European countries over opposition to U.S. possession of Greenland, with a planned increase to 25% in mid-2026. Neither measure ultimately took effect, but they still sent shocks through global markets and had geopolitical effects.39,40,41
However, some items have changed: in the last few weeks, the U.S. established new tariff authorities allowing it to impose additional duties on imports from countries that directly or indirectly provide oil to Cuba or purchase goods or services from Iran, and the U.S. reached a trade framework with India that removed the additional 25% tariff on Indian imports in recognition of India’s commitment to cease purchasing Russian oil and reduced the reciprocal tariff rate from 25% to 18%.42
Legal uncertainty adds another variable. The Supreme Court case from November 5th, which challenges the “Liberation Day” tariffs issued under IEEPA, is still pending, with a decision expected by June 2026. These sweeping tariffs include all countries and currently remain in effect. If The Court overturns them, it opens up many questions regarding potential refunds. These tariffs have generated an estimated $130 billion, a small share of the overall U.S. economy but meaningful at the category level,43 and will likely require a great deal of effort if parties are able to obtain refunds for the related tariff paid under IEEPA.
For project delivery, the key issue is changes to behavior relative to timing of orders. Where importers accelerate or delay orders based on expectations of policy outcomes, we can experience temporary surges in shipping demand and supplier production,44 driving delays or increases. So even if tariffs do not drive broad inflation, they can create sharp, short-lived disruptions.
The national average flatbed spot rate, excluding fuel, rose 1.2% MoM, or just over $0.02, to $2.02 in October.a
Analysis: Rates have increased due to large scale AI data centers.
Recommendation: Continue to bid level the spot market when volume does not make it cost competitive for contract rates.
For the first 45 weeks of 2025, U.S. railroads reported cumulative volume of 10,004,661 carloads, up 1.8 percent from the same point last year; and 12,211,278 intermodal units, up 2.5 percent from last year. Total combined U.S. traffic for the first 45 weeks of 2025 was 22,215,939 carloads and intermodal units; an increase of 2.2 percent compared to last year.b
Analysis: The Rail industry continues to make steady gains. However, tariffs in the commercial market will cause less containers and intermodal port use.
Recommendation: Use rail for heavy items which require cheaper per mile costs, afford flexibility in delivery, and are close to intermodal facilities.
Asia-North America spot rates have increased 45%. Rates to the West Coast increased 48% to $2,958 per FEU last week. East Coast prices fell 3% to $3,513 per FEU for a slight weekly decrease.c
Analysis: While rates are increasing on FEUs to the US West Coast, the larger concern are the tariffs.
Recommendation: If tariff concerns are mitigated then book ocean freight as necessary.
a November 2025 Industry Update: Flatbed | Ryan Transportation
b AAR Reports Weekly Rail Traffic for the Week Ending November 8, 2025
c Freightos Weekly Update dated November 11, 2025
Logistics is where costs, labor, geopolitics, and policy uncertainty converge, revealing risks that stay hidden when volumes are low and conditions look calm. The baseline heading into 2026 looks relatively soft, but triggers could change conditions quickly.
Oil prices are competitive, in the $55 to $65 per barrel range.45 The recent assertion by the U.S. over Venezuela oil had initially pushed oil indexes down further, but they have trended up since, although not enough to significantly affect pump prices. In 2025 the average price for oil was down 16% from 2024, and prices are anticipated to drop further in 2026 by 22%.46
By Land: At a ground-level view, trucking data shows tender rejection rates, a metric that signals trucking constraints, rising in October 2025 but remaining below the five-year average. Outbound tender volume fell 4.4% month-over-month, with October 2025 volumes down 17.3% year-over-year and 26.3% below the five-year average. Spot rates increased modestly, and fuel prices fluctuated before easing late in the year.47
The baseline interpretation is that shippers have leverage and loads are being covered. However, tariff timing or regional demand shifts can tighten capacity quickly. Small triggers can change market behavior.
But regulatory changes introduce risk. Stricter rules for non-domiciled commercial driver’s license holders include new identification requirements and pauses on certain H-2B visas. This could reduce the driver pool. Even in a soft market, labor constraints like this could push rates higher over time, with spot rates already expected to rise modestly later in 2026.48
By Sea: Looking across modes, CH Robinson’s outlook expects stable freight volumes and pricing through the first half of 2026. Ocean freight capacity is expected to outpace demand, putting downward pressure on rates, while Middle East and Suez Canal instability continues to affect routing. And northbound flows from Mexico are expected to increase as trade shifts away from China.49
Infrastructure constraints will add localized disruption, while overall U.S. ports are operating well below congestion thresholds.50 The Vincent Thomas Bridge redecking project will affect the Port of Los Angeles and Long Beach corridor, with directional closures expected from November 2026 through March 2028. Shippers may need to reroute freight during closure windows,51 potentially affecting shipping costs and time frames.
Trade flow data reinforces structural change. U.S. ocean container imports fell 14% year-over-year, imports from China dropped 28%, and exports to China fell 38% in 2025. Lean inventories and tariff uncertainty ahead of Lunar New Year are worth watching, as they may create a surge of demand and increase prices.52 Lower volume in one mode does not eliminate congestion risk in other modes if volume spikes.
Looking ahead, the materials point to a delivery environment with fewer straight lines, where performance depends less on perfect forecasts and more on resilience under stress. Technology adoption, cybersecurity risk, energy constraints, and geopolitical fragmentation appear as structural pressures rather than temporary noise.
AI adoption stands out as a major shift. Seventy-three percent of firms expect AI to power supply chains by 2030, but capability gaps remain. In the last five years, ransomware attacks have risen by 13%, owing to the increased access created by cloud-based planning tools and automated systems. Labor shortages, natural disasters, and geopolitical tension persist as ongoing pressures.53,54
The Forbes 2030 Outlook outlines scenarios centered on regionalization, a talent cliff, escalating cyber risk, and climate resilience. The common thread is a shift away from pure cost optimization toward resilience as a primary objective.55 This sentiment is echoed by GEP’s Outlook Report 2026.56
A practical response focuses on stress testing. The approach includes defining objectives, identifying key risk drivers, running scenarios, and developing pre-approved mitigation playbooks. Teams that do this work up front tend to move faster and incur lower costs when disruptions hit.57
Energy constraints tied to data center growth add another long-term pressure. Data centers are projected to consume 3% of global electricity by 2030, driving the need for additional power generation and grid upgrades, adding to the demand for electrical and construction materials. Energy pricing is under strain, which could be further stressed by the supply shortage of Uranium used as nuclear power fuel, even as Meta is working with Constellation Energy to recommission Three Mile Island nuclear plant in Pennsylvania to help with power generation for AI.58

Did you know? Almost 20% of U.S. power is provided by nuclear power. There is a 50-million-pound shortfall of Uranium, which fuels these plants. (Source: gep.com & eia.gov)
Gas turbine orders now exceed manufacturing capacity, with delivery delays stretching into 2028–2030 for GE Vernova and Mitsubishi.59 These equipment constraints directly affect project phasing and commissioning for related work.
And risk reporting reinforces how disruptions can stack. Cyberattacks targeting logistics systems rose 61% in 2025. Aging infrastructure, extreme weather, and geopolitical fragmentation increase the likelihood of compound events. McKinsey estimates $106 trillion in global infrastructure investment is needed for resilience by 2040.60 That’s almost 2024’s entire world GDP.61
In this environment, the difference is not who predicts the future best, but who manages uncertainty most intentionally. A recent Gardner report highlights common construction supply chain failures: siloed data, poor system integration, limited collaboration, and tools deployed without adoption or change management.62 The 2026 market environment combines selective strength with structural volatility, increasing the need to focus on how projects are planned and delivered.
A recent article by Investopedia discusses “backward Integration” (expanding operations to take ownership over more steps in the supply chain) as a key factor in Apple’s success.63 Greater control earlier in the process leads to fewer problems later. For construction, that means defining standards early, engaging trade partners sooner, and putting guardrails in place before volatility hits, rather than reacting after costs and schedules are already at risk.
DPR’s approach directly addresses those gaps. By investing in integrated data, early engagement, strategic sourcing, prefabrication, and coordination across the Family of Companies, DPR reduces downstream surprises and improves schedule certainty. These investments consistently reduce risk and improve outcomes over the life of a project.
For owners navigating 2026, choosing a partner with this capability matters. The market is uneven, volatility can compound, and supply chain performance increasingly determines project success. DPR’s integrated approach is built for exactly this kind of environment: one where foresight, coordination, and disciplined execution protect budgets, schedules, and outcomes when conditions are anything but predictable.
Supply Chain Generalist
Speed. The cheetah is the fastest land animal at around 70 mph, but the fastest animal on Earth is the Peregrine Falcon. A falcon’s stoop, a targeted hunting dive, can reach speeds up to 3x the cheetah because during her fall, she is aided by gravity and aerodynamics. So, when construction is accelerated and schedules expedited, what is our multiplier? At Skybox Datacenters’ Hutto Data Center Campus, one answer was steel.
This “stoop,” targeted the sourcing and procurement of structural steel (fitup/fitout) such as wide flange, HSS, and angle prior to selecting the fabricator with an eye on faster arrival of steel to the project site. Metal commodities SME, Daniel Neisingh, described that, “Through an open book intermediary to the mill, we priced the steel package with a steel mill (Nucor) and integrated fabrication schedules with mill rolling schedules. This allowed us to determine if project timelines would be met. With an accelerated project schedule, we found that sourcing 50% of the material through a distributor would allow half of the material to be delivered 2-4 weeks earlier than the manufacturer due to pushed out rolling schedules.”
By leveraging our vertically integrated Family of Companies (FoCs), we mitigate cost increases through DPR’s in-house material provider, OES, which manages material procurement, optimizes steel cut lengths to reduce waste, and delivers competitive pricing on an accelerated schedule. Capitalizing on the ever-changing steel market, Neisingh explained that “DPR is positioned for more control of the critical path during Preconstruction to get out of the ground earlier than Industry benchmarks.” On this project, the owner provided the material cut list, but our in-house structural engineers and detailers at GPLA can manage detailing scope and provide steel cut lists as well.
Central region’s Advanced Tech Core Market leader, Ryan Krogstad, expounded,
“[this project allowed us] the opportunity to lock in mill dates much sooner than we would have been able to through the standard drawings, bidding, buyout subcontracting process- which is what was required for our expedited schedule. In this particular case, the equipment lead time was shorter than normal, and we needed the [steel] structure to set equipment vs. storing on or offsite. Not to mention that it allowed us to be further along with MEP systems as we wait for the final electrical piece of equipment to show up.”
Having worked directly with the project team, Neisingh said, “it was a mutual teaching and learning exercise. Although the project team had not done this before, they were team players, open minded, and patient to work together through each step of the process.”
From 13th century scholar, Rumi, “Be motivated like the falcon, hunt gloriously.” If the pursuit for our industry is the speed, quality, precision and freedom that the falcon dive embodies, metal scopes offer an open horizon for collaboration between Preconstruction and the FoCs that multiply control over mill orders, cost, and schedule on behalf of clients and project teams.

Check out our current conditions interactive dashboard.

Download a copy of the report in PDF format.
Information in this report is compiled from third-party reporting that is available to the public. It is not owned by DPR Construction.
United States Census Bureau
United States Department of Labor
United States Energy Information Administration
United States Chamber of Commerce
United States Bureau of Labor Statistics
Engineering News Record
American Institute of Architects
Associated Builders and Contractors
Associated General Contractors of America
1 The Global Economy Is Forecast to Post ‘Sturdy’ Growth of 2.8% in 2026
2 CBO’s Current View of the Economy From 2026 to 2028 | Congressional Budget Office
3 The Global Economy Is Forecast to Post ‘Sturdy’ Growth of 2.8% in 2026
4 EU and Mercosur sign historic agreement creating one of the largest free trade zones in the world
5 Caught Between Superpowers, Canada Seeks a New Path in Beijing
6 President Trump claims USMCA is "irrelevant" ahead of its review this summer, local experts disagree - KVIA
7 US Inflation Calculator: Current US Inflation Rates: 2000-2026
8 AGC Construction Outlook: What’s in the Mix for ’26, Ken Simonson, Chief Economist
9 U.S. Chamber of Commerce Weekly Wrap October 3, 2025
10 NY Fed: Effective Federal Funds Rate
11 With US shutdown over, the data’s coming back. It’s not looking good - Global Construction Review
12 Architecture Billing Index (ABI) November 2025
13 2026 Construction Industry Outlook: Demand Shifts, Rising Uncertainty - AGC News
14 BLS: Civilian unemployment rate
15 U.S. on verge of unemployment surge that forces Fed to slash rates, Wall Street veteran says
16 Q3 2025 Market Conditions Report | DPR Construction
17 FEDERAL RESERVE BANK OF SAN FRANCISCO
18 Construction Costs Rise At Fastest Rate Since January 2023 In November, Outpacing Increases In Contractors’ Bid Prices For New Buildings - AGC News
19 NORTH AMERICAN MANUFACTURERS CUT ORDERS AS SUPPLY CHAINS REMAIN UNDERUSED
20 Spare Capacity Persists Globally as North America and Europe See Renewed Pullback in Manufacturing Demand
21 DPR Construction Forecast and impact dashboards
22 DPR Construction Forecast and impact dashboards
23 Copper Hits Record $13,000 as US Import Rush Fires Up Bulls
24 2026 Construction Industry Outlook: Demand Shifts, Rising Uncertainty - AGC News
25 London Metal Exchange
26 Precious metals rise early in 2026 on rate cut bets and safe-haven demand
27 China to restrict silver exports, echoing rare earths playbook
28 Silver prices: Why is silver not on Canada's critical mineral list?
29 High-purity critical rare earths to be produced from dead magnets at 1,800-acre US site
30 Trump Holds Off on Critical Minerals Tariffs After Trade Probe
31 China Fires Rockets Near Taiwan in Display of Military Power
32 China to regulate steel exports with a license system
33 USMCA Review Poses Stress Test for North American Supply Chains | SupplyChainBrain
34 Trump deems USMCA 'irrelevant' as trade deal faces renegotiation
35 Metals sector braces for high-stakes USMCA trade talks
36 Mexico tariff: Exporters push for FTA, supply-chain rejig
37 Fact Sheet: President Donald J. Trump Adjusts Imports of Timber, Lumber, and Their Derivative Products into the United States
38 US plans fresh China semiconductor tariffs for 2027
39 Trump announces 25% tariff on any country doing business with Iran
40 Trump Announces New European Tariffs in Greenland Standoff; Allies Outraged
41 Trump says he reached Greenland deal ‘framework’ with NATO, backs off Europe tariffs
42 https://www.whitehouse.gov/fac...
43 The longer the Supreme Court delays its tariff decision, the better it is for President Trump
44 Supreme Court tariff ruling: It’s not just about refunds. Volume of U.S. freight trade could hinge on decision
45 Oil Price Charts | Oilprice.com
46 GEP Outlook Report 2026 | Procurement & Supply Chain Trends | GEP
47 Ryan Transportation: November 2025 Industry Update
48 New Federal Rule on Non-Domiciled CDLs: What Drivers Need to Know
49 CH Robinson: 2026 Freight Market Outlook
50 CH Robinson 2026 Freight Market Outlook
51 CH Robinson: Ocean Freight & Air Freight Markets And Major Trade Policy And Customs Updates
52 Supreme Court tariff ruling: It’s not just about refunds. Volume of U.S. freight trade could hinge on decision
53 73% of Firms Expect AI To Power Supply Chains By 2030 - Curated supply chain news and Insights | Supplychain360
54 100+ Ransomware Attack Statistics 2026: Trends & Cost
55 4 Scenarios That Will Shape Supply Chains By 2030
56 GEP Outlook Report 2026 | Procurement & Supply Chain Trends | GEP
57 4 Steps To Stress-Test Supply Chain Strategy - Curated supply chain news and Insights | Supplychain360
58 Meta strikes 20-year nuclear power deal with Constellation Energy • Pennsylvania Capital-Star
59 Key themes 2025: what data centres, tariffs and grid bottlenecks mean for the energy transition
60 2026-Annual-Report-Everstream-Analytics.pdf
61 World GDP 2025 - StatisticsTimes.com
62 Why reactive supply chains are losing their competitive edge
63 Notable Backward Integration Examples: Apple and Carnegie Steel
Photos: Danny Sandler


National Preconstruction Leader
Posted on February 18, 2026
Last Updated March 13, 2026
File Download


